
Wind mapped over the terrain, not guessed from one station
LR-x® runs a U.S. Army Research Laboratory 3D wind field model that works out how wind moves over the hills, valleys and buildings around your incident. Here is what it does, what goes into it and where its limits are.
Why one wind reading misleads in rough country
Most plume tools take a single wind speed and a single direction and apply them to the whole area downwind. ALOHA, the EPA/NOAA dispersion model, works this way: it lets you enter only single values for wind speed and direction, assumes they stay constant downwind, and expects the ground under the cloud to be flat.[1][2]
NOAA is direct about what that misses. Wind "typically shifts speed and direction as it flows up or down slopes, between hills or down into valleys, turning where terrain features turn." Around large buildings it "forms eddies and changes direction and speed, significantly altering a cloud's shape and movement."[1] NOAA's term for this is terrain steering.[2]
So the station reading at the airport, or the anemometer on your engine, tells you what the wind is doing there. It does not tell you what it is doing in the drainage two miles away, on the ridge above it, or between the tanks at the plant.
Weather station · arrow length = wind speed · thin lines = elevation contours. A simplified sketch, not model output.
How the model builds a wind field
The model is the Army Research Laboratory's Three-Dimensional Wind Field (3DWF) model, developed by Dr. Yansen Wang at ARL in Adelphi, Maryland.[3][9] It is a diagnostic model based on mass conservation: given a limited number of observed or forecast wind profiles, it spreads them across a 3D grid and adjusts them so no air is created or lost. In the paper's words, the wind field "is physically interpolated in such way that mass conservation is satisfied."[4]
Because air has to go somewhere, the grid forces it over ridges, along valley floors and around obstacles. ARL describes the model as including "the effects of topography and small surface features such as forest areas and buildings."[3] In ARL's tests it reproduced the slowdown of wind on the upwind and lee sides of a hill and a speed-up of about 1.5 times at the top, and in California's Salinas Valley it showed wind channeling along the small valleys between hills, stronger on the peaks and weaker in the valleys.[4]
Around structures, the Army explains, slower or even circular air can form on the downwind side of a building, and alleyways can act as wind tunnels; L-REAC™ (the ARL system LR-x® grew from) was built so a responder could see how those effects alter a plume.[9] In LR-x®, that is how the model can show eddy currents that concentrate a plume around buildings, and help pick the safest ingress and egress routes.
What goes in
"The models themselves, in order to be appropriate for an area, need to know about the area, what is the terrain and what is the morphology," ARL meteorologist Gail Vaucher said of L-REAC™.[9] The model needs two things: weather and the shape of the ground.
Weather
- The nearest reporting public weather station, pulled automatically when you place the incident, so the first model can run while you're en route.[12]
- Your own sensor on scene, such as a Coastal Environmental Systems WEATHERPAK®, for hyper-local readings once you set up.[12]
- Forecast weather, which drives the forecast models.
The ARL patent describes the sensors as measuring wind speed and direction, temperature, humidity and barometric pressure, and the model as calculating "a projected wind flow over the area of interest on a 24/7 basis."[10]
Terrain
- USGS 1 arc-second Digital Elevation Models for the entire U.S. and U.S. territories.[12] USGS puts that at roughly 30 meters between elevation points.[11]
- NASA Shuttle Radar Topography Mission (SRTM) elevation data. LR-x® terrain coverage reaches about 80% of the world, everywhere except the extreme polar regions.
- LIDAR-scanned topography, when you have it.[12]
Detail matters. "The more details you have, the better the results," Vaucher said. "If you have a generic description, you'll get a generic result."[9]
Resolution and speed
A diagnostic model like this one leaves out the thermal and momentum equations of a full weather model.[4] ARL chose this model for L-REAC™ because "it had the capability to not only render very quickly, but it can look at many different scales."[9]
- LR-x® grids
- Two per run: 5 meter and 50 meter[13]
- First model
- Wind field and plume in under 5 minutes[12]
- Forecasts
- 3 forecast models, one about every 2 minutes
- L-REAC™ scales
- Building (5 m), cantonment (50 m) and regional (100 m); output every 2–10 minutes depending on resolution[7]
- ARL test case
- A 2 km × 2 km hill at 10 m horizontal and 2 m vertical spacing (200 × 200 × 100 grid points) in about 2 minutes of CPU time on a 2009-era desktop PC[4]
How it works with the ALOHA plume model
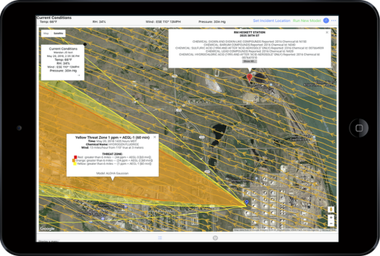
In the ARL system, the same weather data feeds both the wind model and the plume model, and both results are mapped over the area of interest. Wind and plume can be laid onto a single map, with wind direction shown by arrows and streamlines and wind speed by color.[7] LR-x® keeps that design: each run gives you the two wind field resolutions plus an ALOHA plume overlay, for current conditions and each forecast.[13]
ALOHA still draws its threat zone from one wind speed and direction over flat ground.[1] The wind field is what lets you check that against the land. NOAA's advice for dangerous, stable conditions is to "look for physical depressions and topographic features that may trap or steer the dispersing cloud."[2] With LR-x® those features, and what the wind is doing over them, are on the same screen as the red, orange and yellow zones.
Reading tip: where streamlines bend away from the straight axis of the threat zone, or speed colors change sharply across a ridge or a row of buildings, that is where the real plume is most likely to depart from ALOHA's straight-line footprint.
More on the plume side: LR-x® and ALOHA.
Take the wind field into ArcGIS
LR-x® exports the real-time plume model, the real-time 3D wind field model and the three forecast models as KML files you can use in ArcGIS. That puts the terrain wind field and threat zones next to your own GIS layers, such as hydrants, schools, pipelines or pre-plans. Other GIS tools that import KML, such as Google Earth, can open the files too.
See Works with your GIS.
Where the model is less reliable
Any model has limits, and you should know these before an incident.
- Light, thermally driven winds. ARL found the model gives a reasonably good wind field in moderate to strong winds, but cautioned that it "is not equipped to handle" weak-wind cases where the flow is thermally driven, such as nighttime drainage.[5] ARL has added parameterizations for drainage flow, mountain-valley flow, building wakes and forest canopies,[4][6] but treat light winds with extra care.
- The lee foothills of steep terrain. In ARL's hill test the largest errors were at the lee-side foothill, where turbulent reversal flow occurs.[4]
- Very stable air. NOAA warns that very stable conditions, usually late at night or early morning, make models like ALOHA unreliable and can let heavy gases pool in low ground.[2]
Where the model came from
ARL published the initial development report for the model in October 2003.[3] Its use in L-REAC™ grew out of the 2003–2007 White Sands Missile Range urban field studies, which looked at airflow around a single building and small building clusters.[8] In April 2011, during the Abrams Fire, L-REAC™ produced wind fields for the installation operations center, fire departments and the Bureau of Land Management.[14] ARL's patent on the system, U.S. Patent 9,911,303, was granted on March 6, 2018, and names the 3DWF model as a wind flow model the system can use.[10]
Where terrain matters most: wildfire smoke and wind, rail lines through hills and canyons, military and CBRN, and sour gas wells, where heavy H2S follows low ground. See every facility type where LR-x® fits.
LR-x® models hydrogen sulfide (H2S) and chlorine releases. Both gases are heavier than air. LR-x® maps the wind over the actual terrain, so you can see how air is moving through valleys and low ground and judge where a heavier-than-air gas may flow and collect.
Questions about the wind model
What is a 3D wind field model?
A model that estimates wind speed and direction at every point of a three-dimensional grid over an area, rather than at one spot. The Army Research Laboratory model in LR-x® is a diagnostic, mass-consistent model: it starts from measured or forecast winds and adjusts them so that air flows realistically over and around the terrain, buildings and vegetation in the grid.
Why not just use the wind from the nearest weather station?
One reading is one speed and one direction. NOAA notes that real wind "typically shifts speed and direction as it flows up or down slopes, between hills or down into valleys," and that ALOHA, which takes single values for wind speed and direction, ignores those effects. In rugged country the wind at your incident can differ from the wind at the station.
What terrain data does LR-x® use?
USGS 1 arc-second Digital Elevation Models (roughly 30 m spacing) for the entire U.S. and U.S. territories, and NASA Shuttle Radar Topography Mission data, so LR-x® terrain coverage reaches about 80% of the world, everywhere except the extreme polar regions. LIDAR-scanned topography can also be ingested.
How detailed is the wind field and how fast does it run?
Each LR-x® model run produces two wind field resolutions, 5 meter and 50 meter. The first wind field and plume model is ready in under 5 minutes, and three forecast models follow, one about every 2 minutes.
Does the 3D wind field change the ALOHA threat zone?
ALOHA itself uses one wind speed and direction and assumes flat ground. LR-x® runs ALOHA from the same weather data and draws its threat zone on the same map as the terrain-aware wind field, so you can see where ridges, valleys and buildings are likely to turn or speed up the air around the plume. NOAA advises responders to look for topographic features that may trap or steer a cloud; the wind field shows you where they are.
When is the wind model less reliable?
ARL's own testing found the model works well in moderate to strong winds and urged caution in weak winds where the flow is thermally driven, because a mass-consistent model does not solve for those effects. Treat light-wind, very stable conditions with extra care, as NOAA also advises for ALOHA.
Can I export the wind field to ArcGIS?
Yes. LR-x® exports the real-time plume model, the real-time 3D wind field model and the three forecast models as KML files you can use in ArcGIS.
Sources
- NOAA Office of Response and Restoration, ALOHA's Limitations.
- U.S. EPA and NOAA, ALOHA User's Manual, 2007.
- Y. Wang, J. Mercurio, C. Williamson, D. Garvey, S. Chang, U.S. Army Research Laboratory, A High Resolution, Three-Dimensional, Computationally Efficient, Diagnostic Wind Model: Initial Development Report, October 2003.
- Y. Wang, C. Williamson, D. Emmitt, S. Greco; 89th AMS Annual Meeting, paper 7.2, An Improved Diagnostic Wind Model and Its Initialization Using the Airborne Doppler Wind Lidar Data, January 2009.
- Y. Wang, C. Williamson, G. Huynh, D. Emmitt, S. Greco; The Open Remote Sensing Journal 3, Diagnostic Wind Model Initialization over Complex Terrain Using the Airborne Doppler Wind Lidar Data, 2010.
- Y. Wang, R. Cionco, U.S. Army Research Laboratory, Wind Profiles in Gentle Terrains and Vegetative Canopies for a Three-Dimensional Wind Field (3DWF) Model, July 2007.
- G. Vaucher, U.S. Army Research Laboratory; 93rd AMS Annual Meeting, paper 4.4, Saving Lives with L-REAC®, an Airborne Health-Hazard Decision Aid, January 2013.
- G. Vaucher, U.S. Army Research Laboratory, L-REAC® System, Design and Development, Volume 5 (Mobile L-REAC System Proof of Concept and Four Feasibility Studies), ARL-TR-6275, December 2012.
- J. A. Hamilton, Army News Service, Army lab developing gas 'plume' detection system to protect Soldiers, first responders, March 2012.
- G. Vaucher, R. Brice, S. Luces, S. O'Brien; assigned to the U.S. Army, U.S. Patent 9,911,303, System to Evaluate Airborne Hazards, March 6, 2018.
- U.S. Geological Survey, 1 Arc-second Digital Elevation Models (DEMs), 3DEP.
- Diamond B Technology Solutions, LR-x® White Paper, 2018. PDF, 2018 edition; some product details have since changed.
- Diamond B Technology Solutions, LR-x® product specifications and pricing.
- U.S. Army Research Laboratory, L-REAC™ and the Abrams Fire, April 2011 (case study). PDF.
See LR-x® run on a real incident location
We will walk your team through a live model for an address in your response area. Or start a 30-day free trial and run it yourself.